Transparently Tracking and Communicating Progress and Growth in Competency-Based Schools
CompetencyWorks Blog
Links to other posts in this series by Sandra Moumoutjis are at the end of this article.
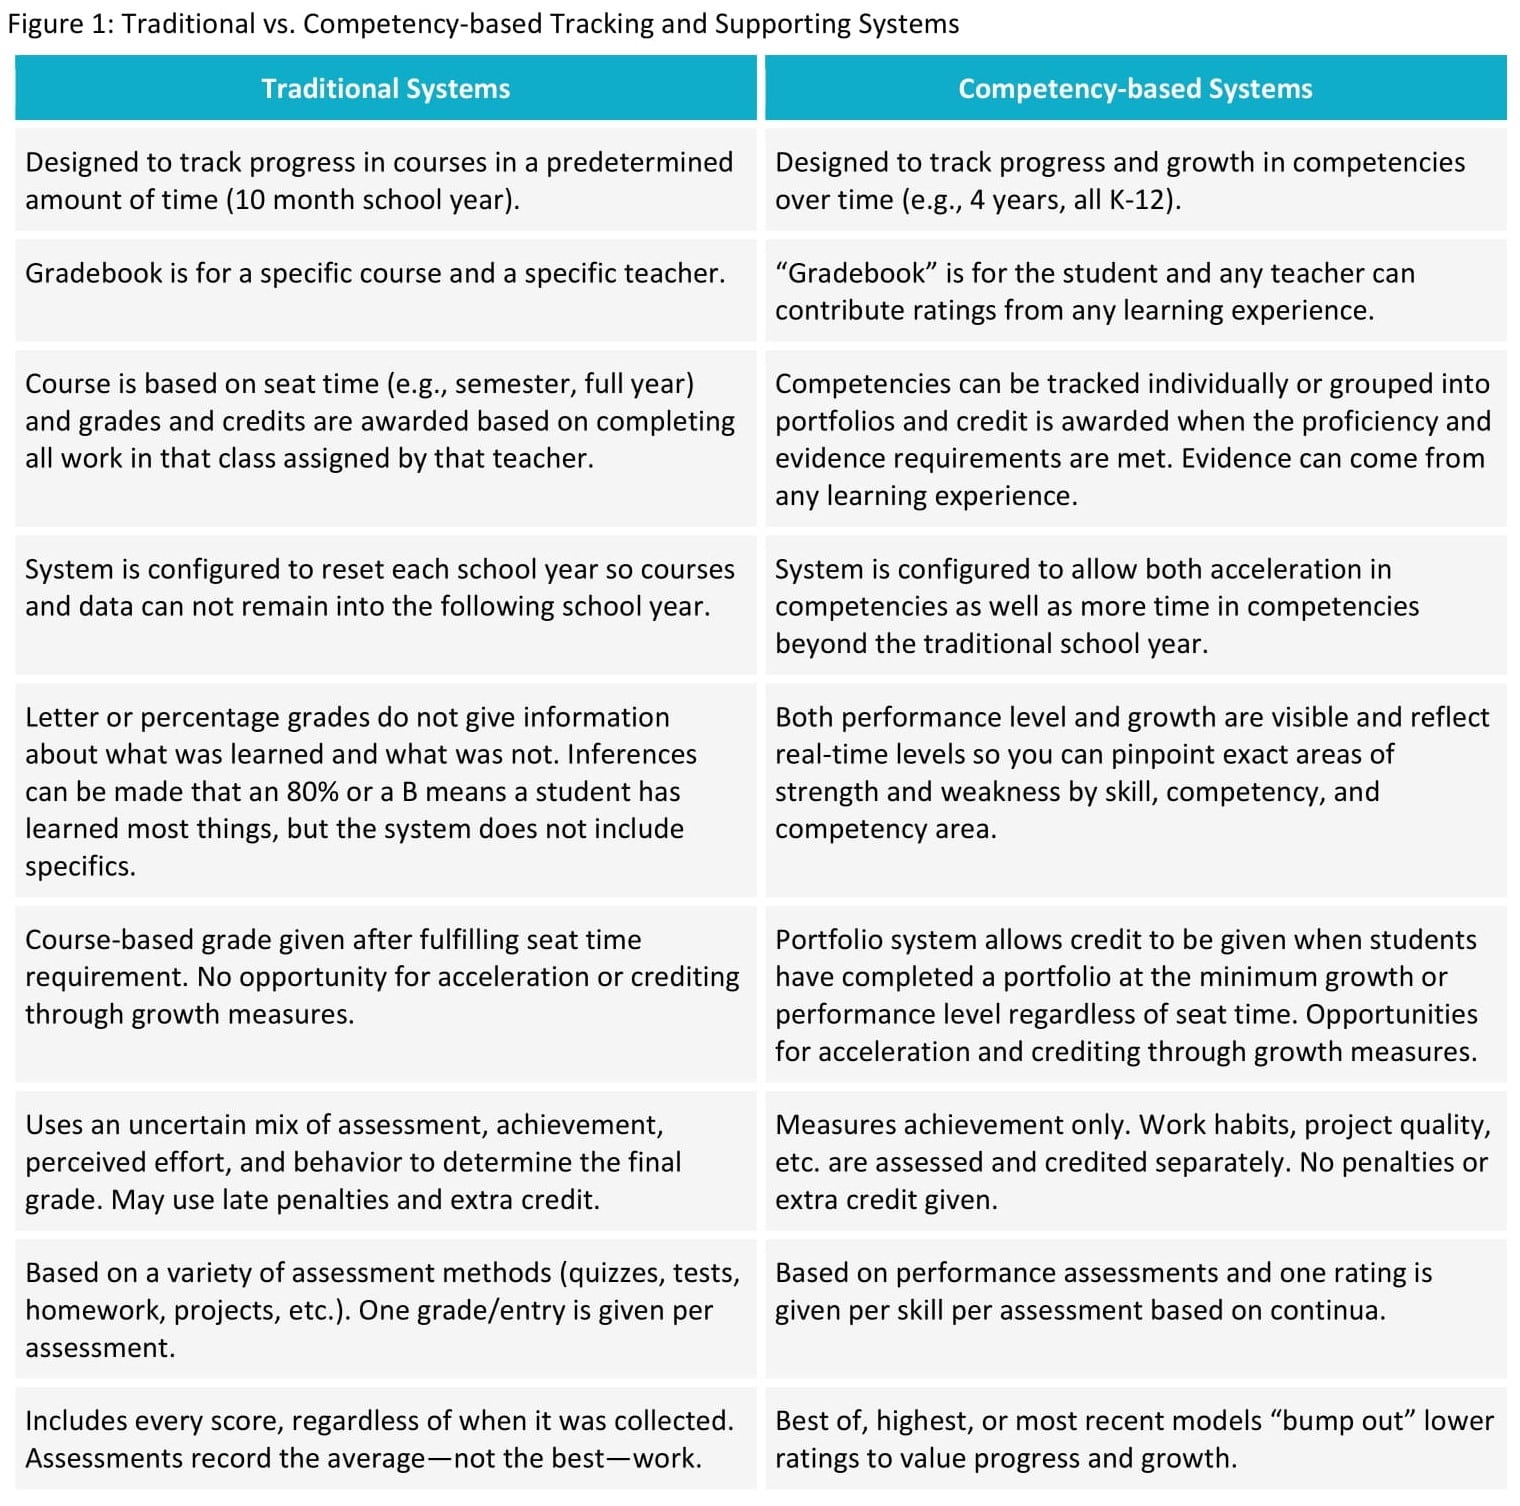
Many of the schools we work with initially come to us looking for help in tracking and communicating how students are performing in their competency-based models. The ability to track, monitor, and communicate student progress and growth transparently in a competency-based model remains one of the biggest challenges when transitioning to CBE. It is essential to the success of CBE to find the right systems and tools to support this new grammar of schooling. Many systems that schools use for tracking and reporting are designed and built for the traditional time-based, grade-based, course-based structures. The table below outlines some of the fundamental differences between traditional systems and competency-based systems.
So what are the systems that CBE models need and how do we transition from teacher gradebooks to student “gradebooks” and time being variable instead of time being fixed?
When we first began our work in CBE, we assumed we would be able to adopt a system that measured and tracked competencies over time. After extensive research, we realized there was not yet a system that could support our vision. So we had to build our own. We challenged ourselves to rethink the traditional structures that were the barriers to all of the existing systems and to build a system that was for the student, not the teacher.
Our first step in the process was to develop our competencies and learning progressions, or continua as we call them. We wanted students to work on the same competencies every year and use the content as the context for demonstrating the competencies we identified as essential for postsecondary readiness. Before you make any decisions about competency-tracking systems, you must first have your competencies organized within a consistent framework. We wrote all of our competencies using the same taxonomy and rating system to support a seamless implementation from K-12. Figure 2 shows the learning progression or continuum for one skill – Seek Support and Resources – in our Building Networks competency, which is part of the Habits of Success (HOS) competency set.
Figure 2: Building 21 Competency Taxonomy
Once we developed our competency framework, we challenged ourselves to define a new structure for organizing teaching and learning. Instead of courses and grade levels, we developed our competency portfolio model and designed a system to track competencies over time in these portfolios. Here are the ways our system rethinks traditional structures and puts student learning at the center:
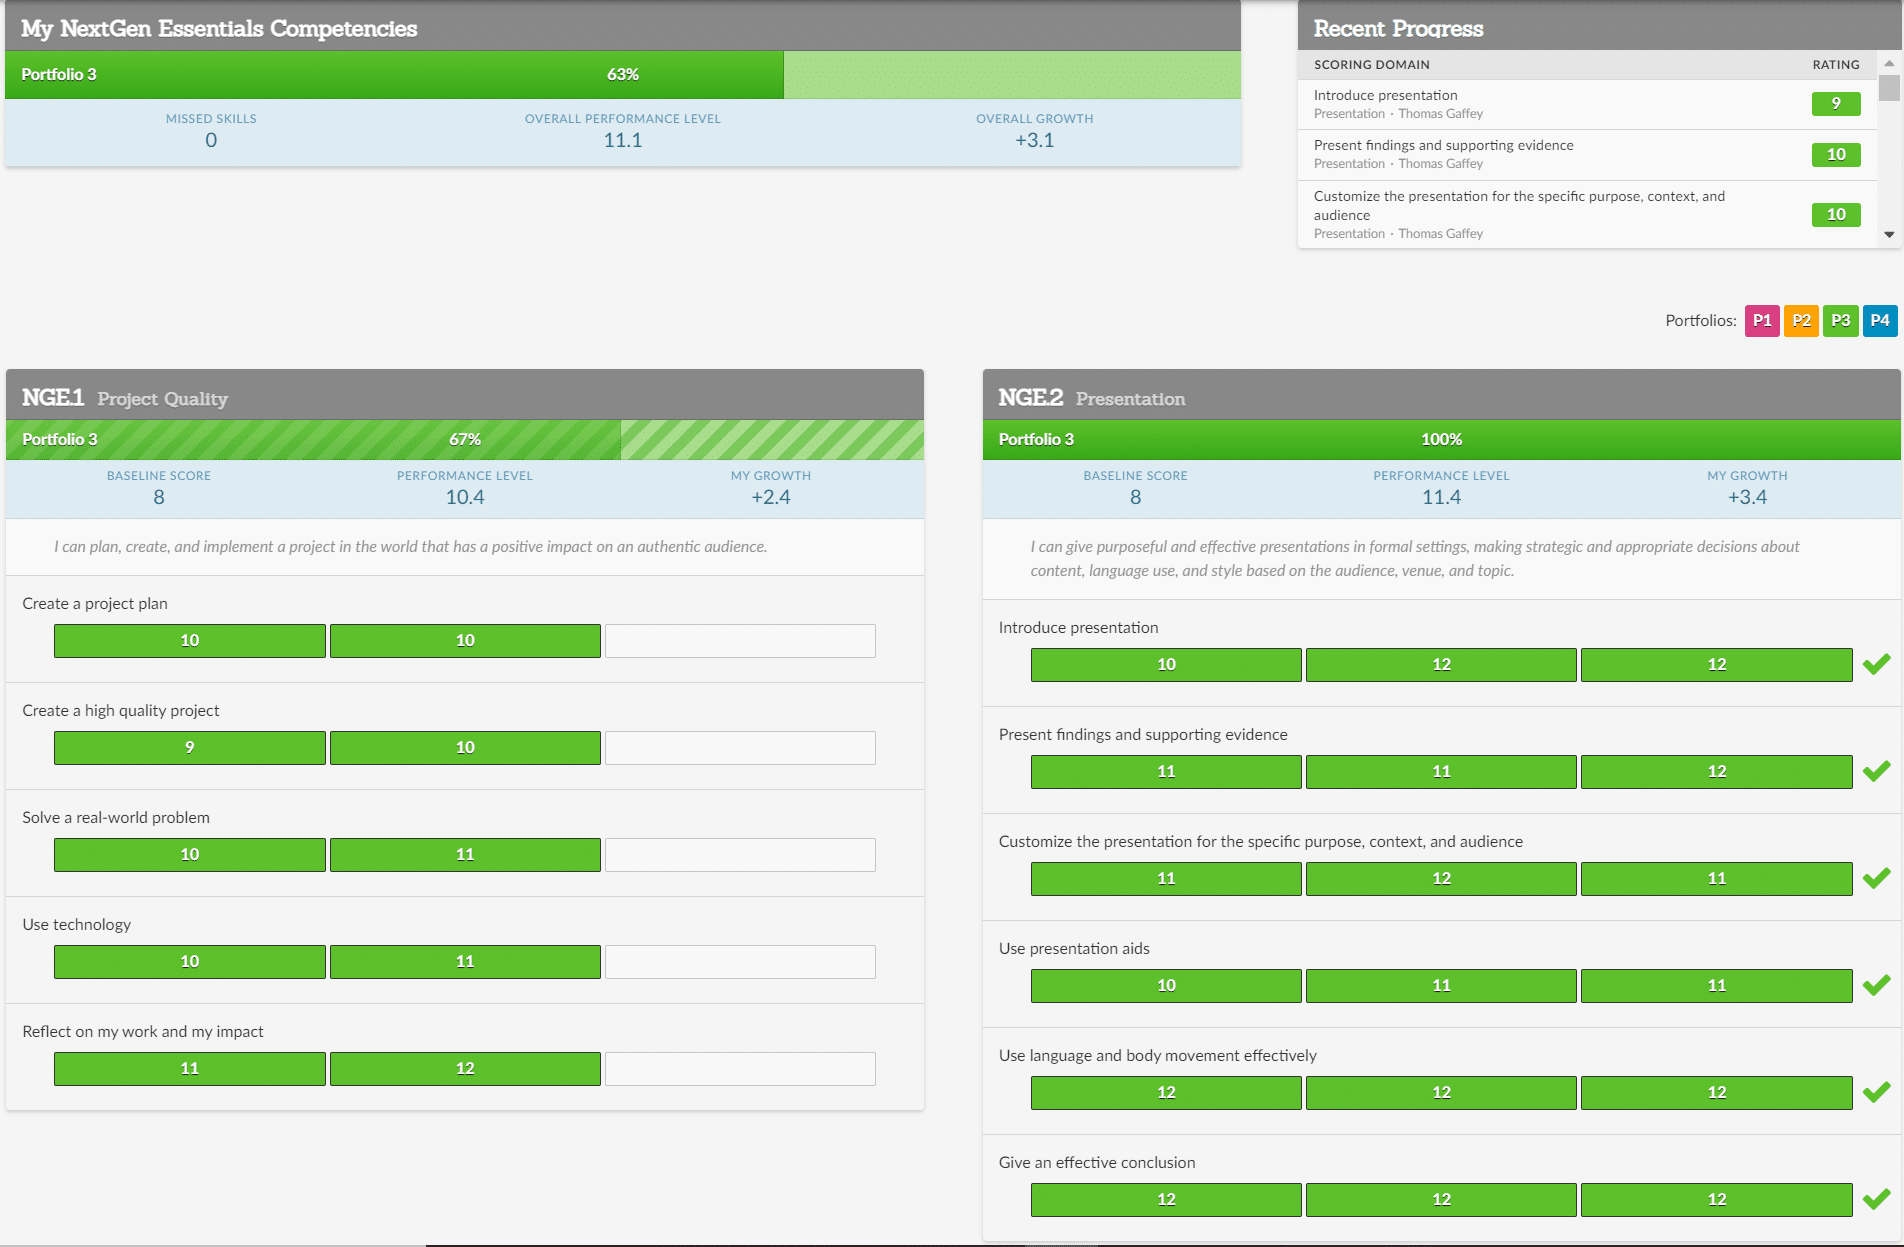
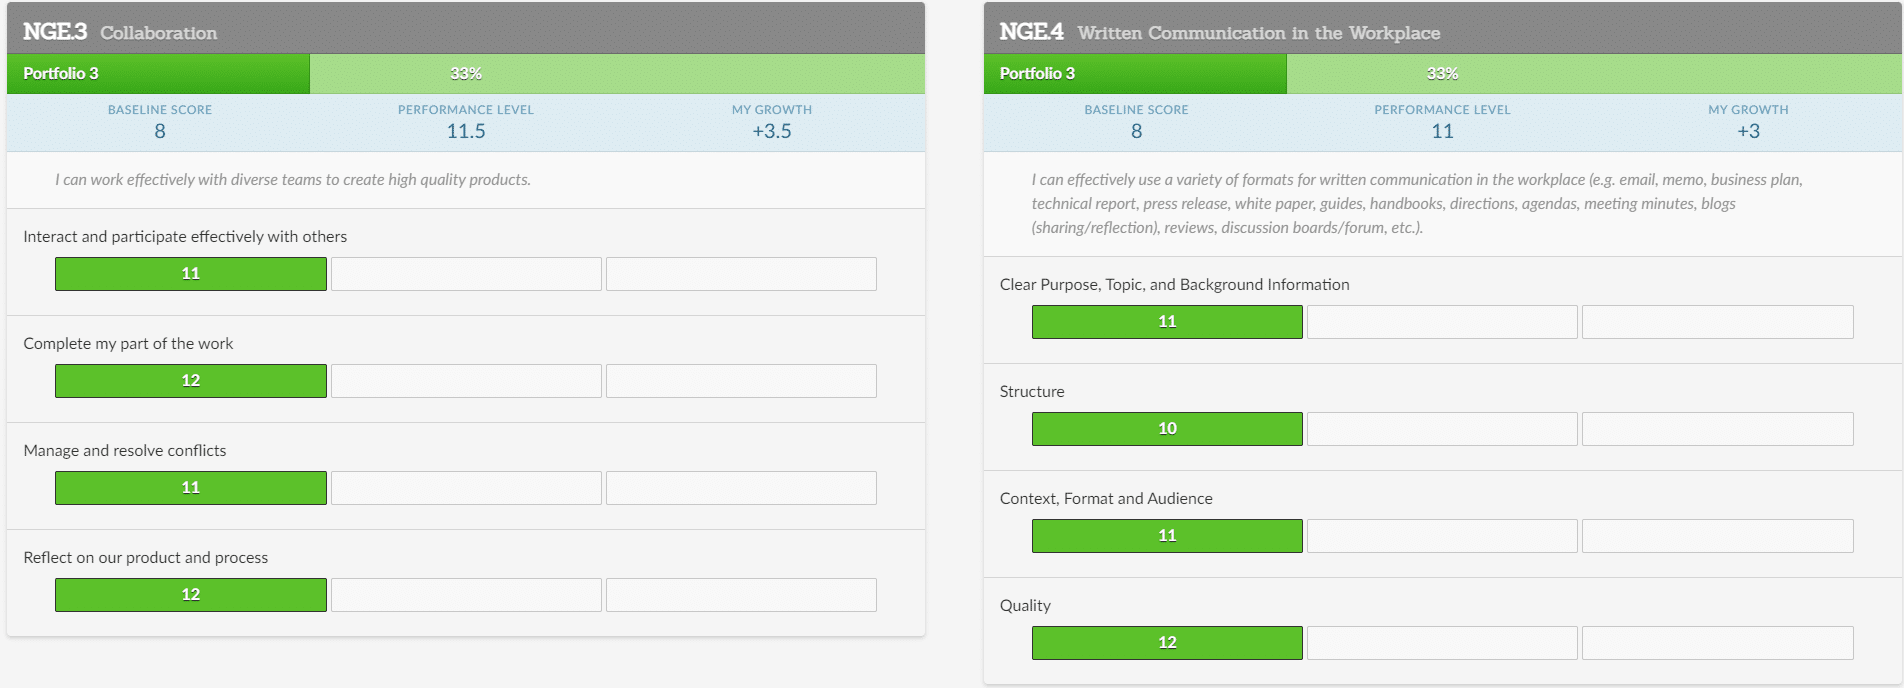
- Instead of organizing learning by courses, our system organizes learning by competencies. Competencies are tracked individually or organized into portfolios. The image below shows an example of how we organize competencies into a portfolio.
Figure 3: Example of a NextGen Essentials Student Portfolio
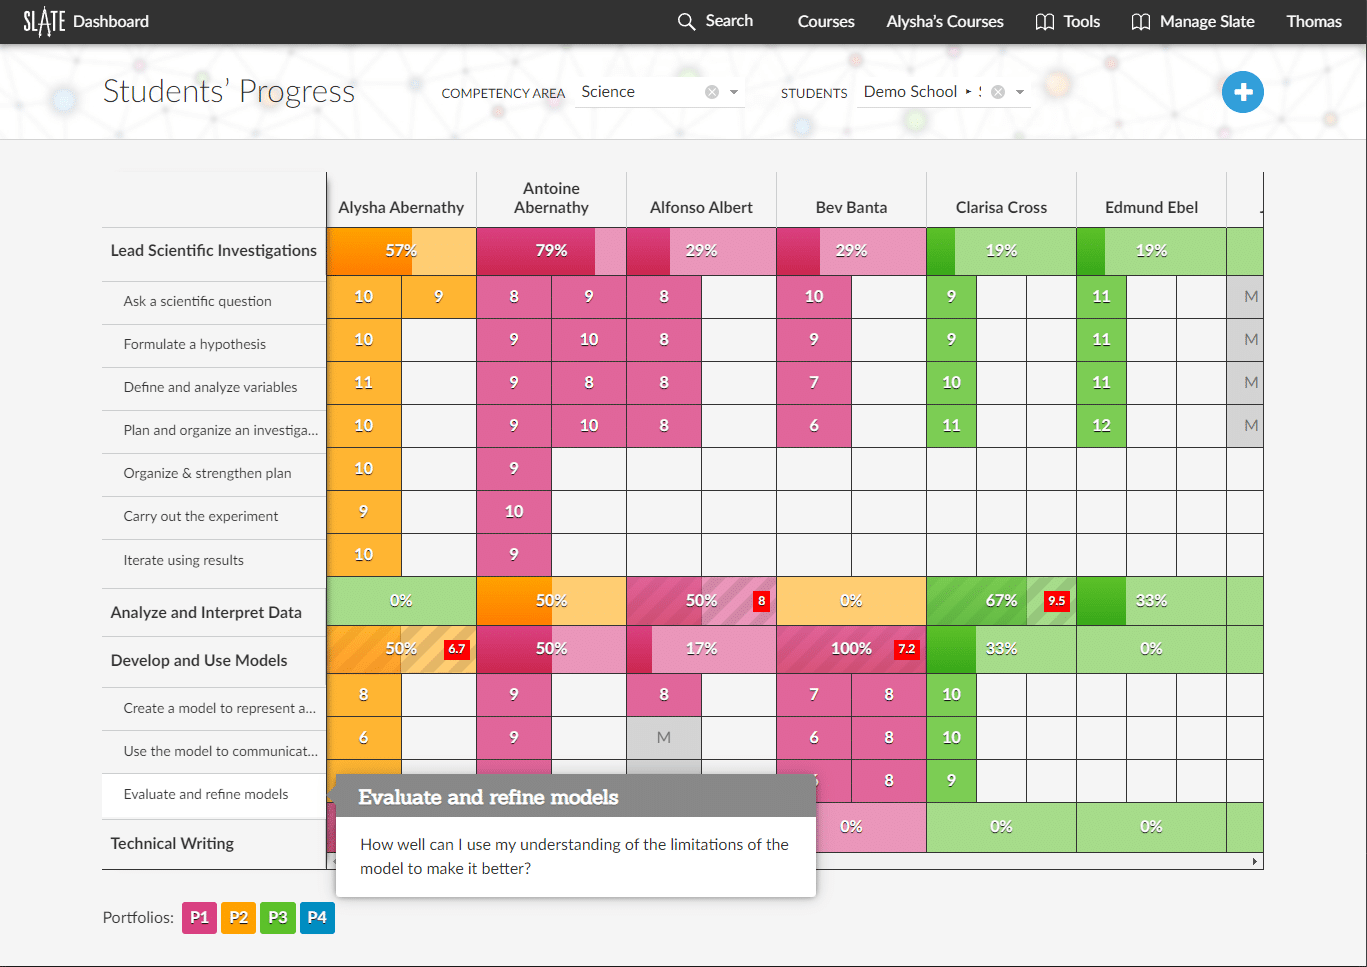
Our competencies remain the same each year, so the system does not need to be reset. Every rating for every competency remains in the system to allow for tracking progress and growth over time. Students can work in different-level portfolios at the same time, because the system is not based on grade levels. The image below shows students in the same studio working on the same science competencies, but at different portfolio levels, as well as students working in two different levels in the same competency area.
Figure 4: Students in Different Levels in Science Portfolios
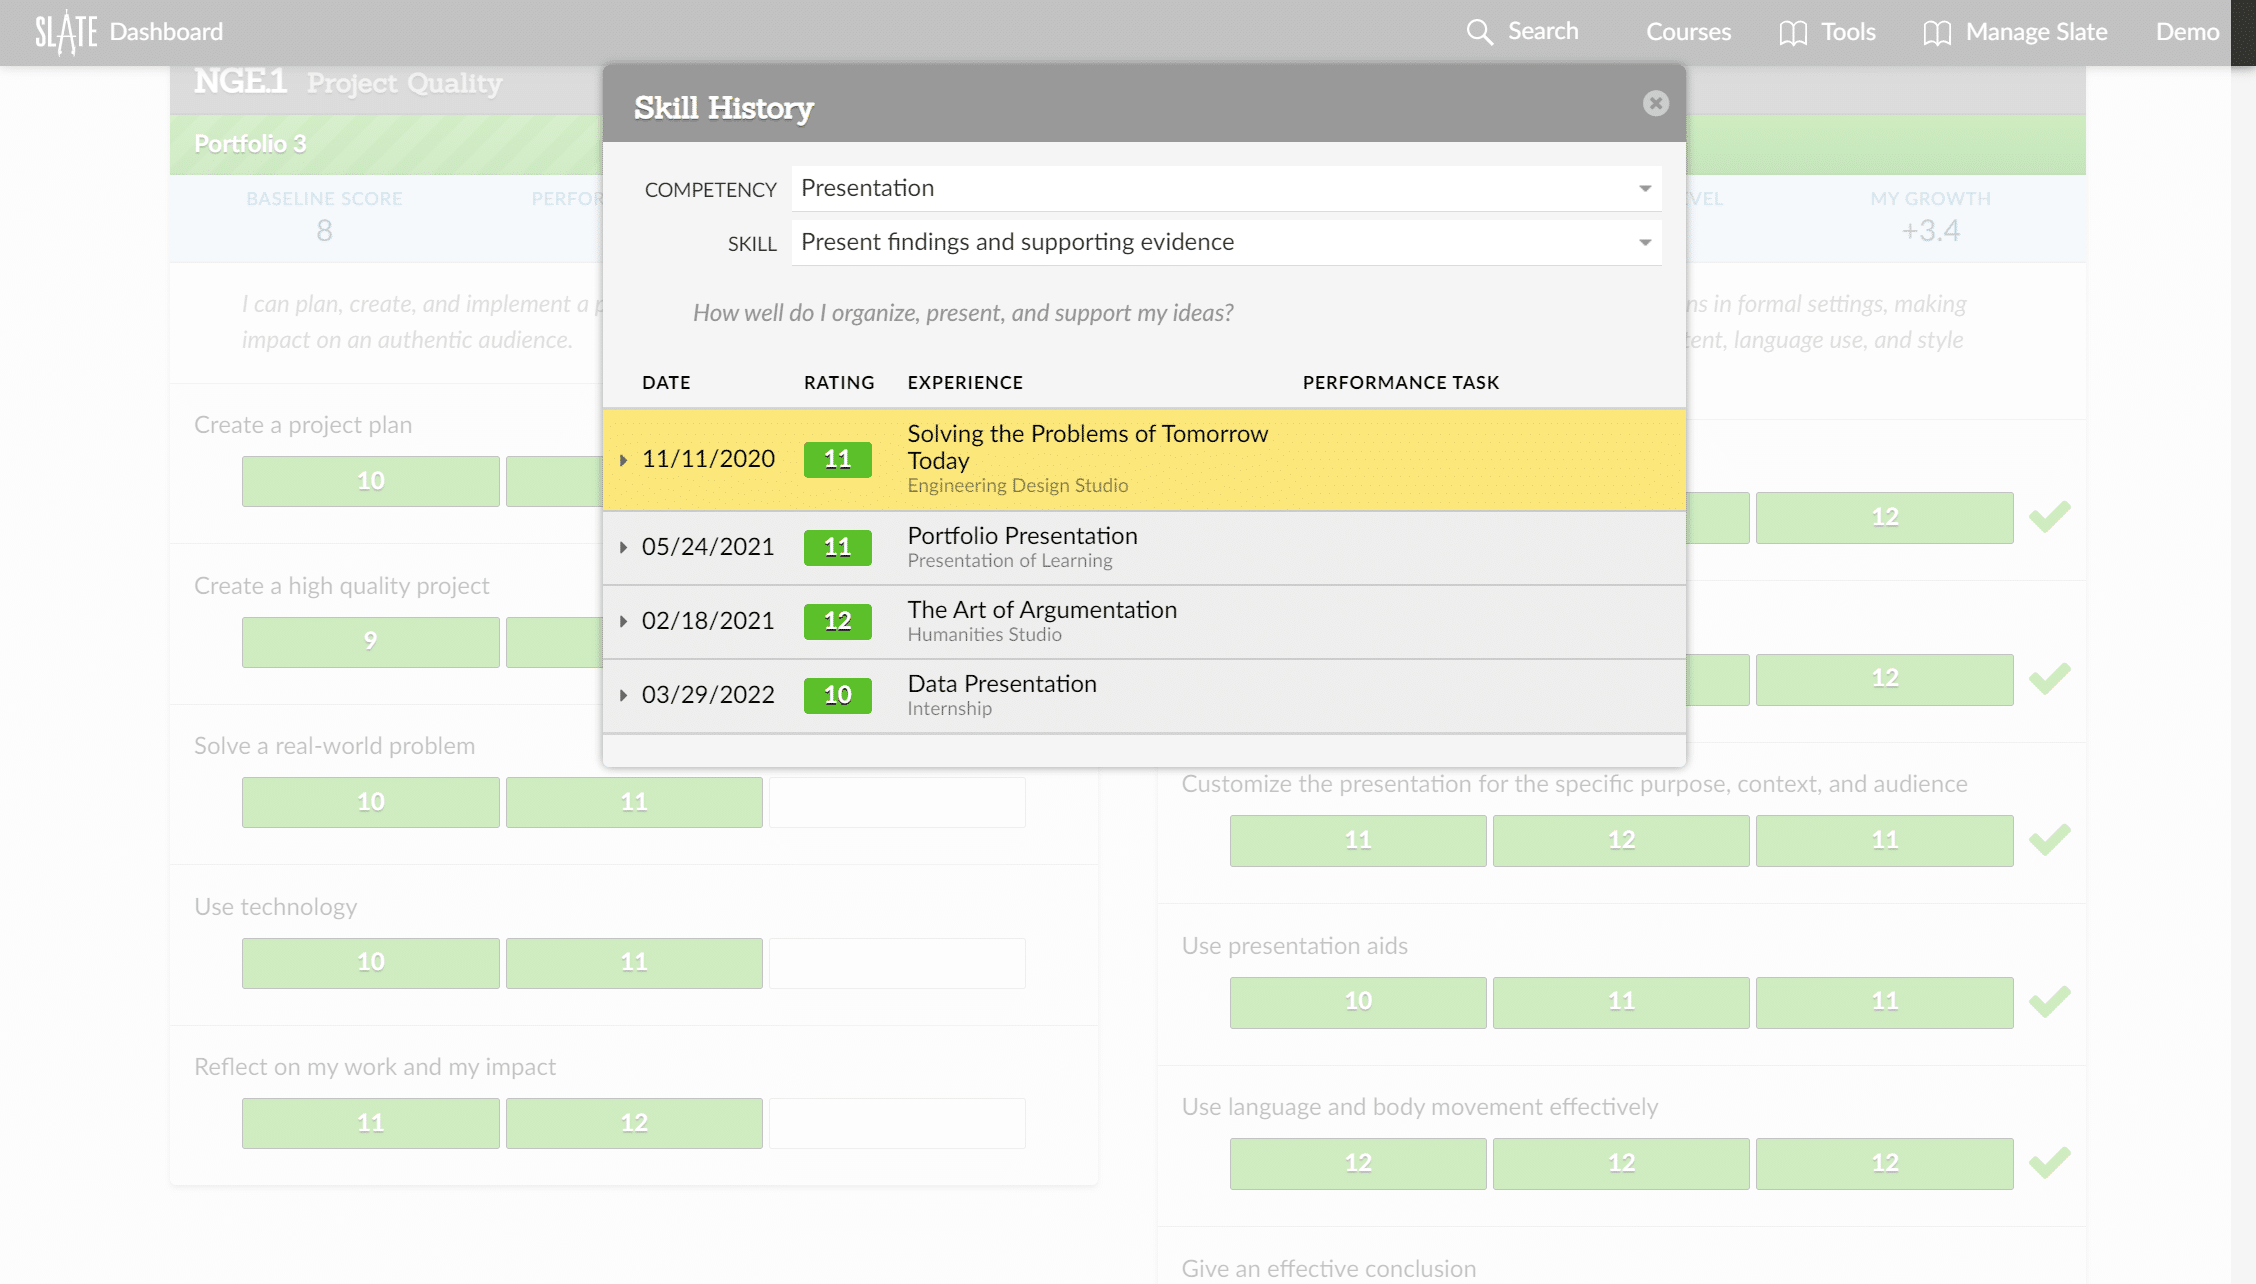
Students, not teachers, own the “gradebook” in our system. This means that any teacher or learning experience can contribute to evidence of mastery for a competency. And competencies can be demonstrated anywhere, not just during a content specific course – including through out-of-school experiences. Ratings are not siloed in a teacher’s gradebook for a course, but are accumulated in a student’s “gradebook” over time, allowing for growth and progress to be valued and measured everywhere a student demonstrates their learning. The image below shows how a student was rated for the Presentation competency in four different experiences by four different teachers.
Figure 5: Presentation Competency Ratings from Different Learning Experiences and Teachers
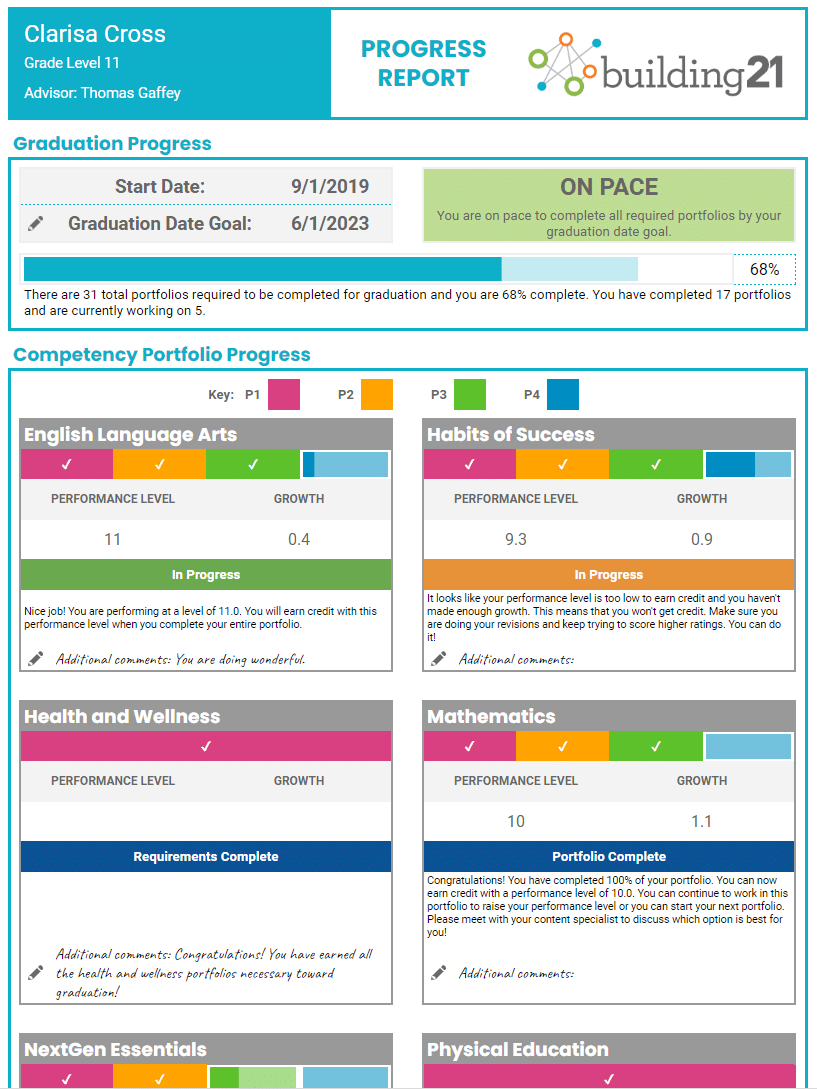
Building this system was the first step in collecting and tracking competency data for each student. But we quickly realized we needed a way to communicate to students and families what growth and progress in this competency model means in terms of graduation readiness. Using customized Google sheets, we developed a progress report that summarized each student’s progress in our competency model and whether they were on track for 4-year graduation. Through multiple design and feedback cycles, the progress report evolved into an effective tool to show real-time competency data to students and families.
Figure 6: Example “My Progress” tab in a student Personalized Learning Plan (PLP)
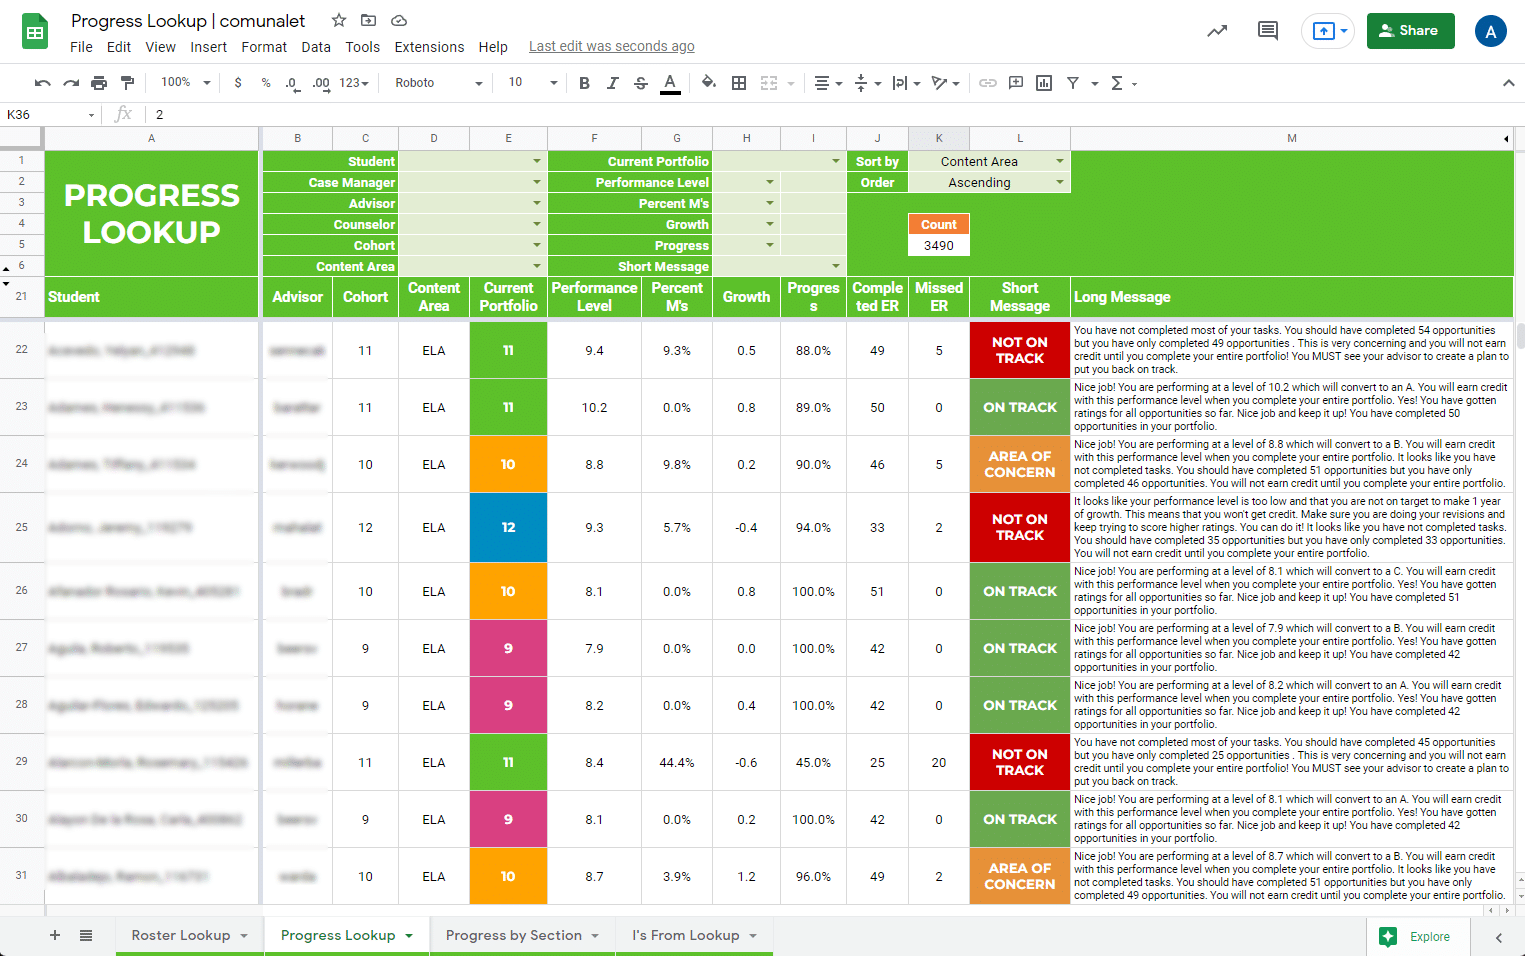
Another challenge we faced was that there was no easy way for teachers to see how all of their students were doing in their studios and there was no easy way for leaders to see overall data for their school. In this same Google Sheets prototyping system, we built a variety of teacher and leader data dashboards to provide them with multiple ways to view and filter data. These dashboards allowed teachers and leaders to evaluate the effectiveness of the teaching and learning and to make data-informed decisions to improve the implementation of the competency model. For example, the teacher dashboard below shows students’ performance level, progress, and growth in their ELA portfolio as well as any opportunities they had to submit evidence to their ELA portfolio but did not (Ms = Missed Opportunities).
Figure 7: Teacher Progress Lookup Dashboard
Over time, we realized just how powerful this Google Sheets prototyping system could be. Students, families, teachers, and leaders were using multiple systems to track and monitor relevant data (e.g, attendance and behavior data from the student information system (SIS), assessment data for state testing, STAR, and NWEA MAP data), so we focused on storing and displaying this data all in one place. However, over time, this dashboard system in Google Sheets could not handle the amount of data we were trying to store and display. We created our own data warehouse that allowed us to automatically ingest and store data from all the different systems schools were using and then display that data for students, families, teachers, and leaders in a variety of flexible data dashboards.
The student Personalized Learning Plan (PLP) evolved into a set of dashboards that displays all relevant data for students and families in one place. The PLP shows competency progress, graduation credits earned and in progress, attendance and behavior data, state and other assessment data (e.g., Keystones, NWEA MAP, STAR). Students can also self-assess on the Personal Growth and Development competencies and set and track their goals. Additionally, students can monitor their productivity or task completion, track learning experiences occurring both in and outside of school, and reflect on their learning. Click this link to see the different tabs in one of our sample student PLPs.
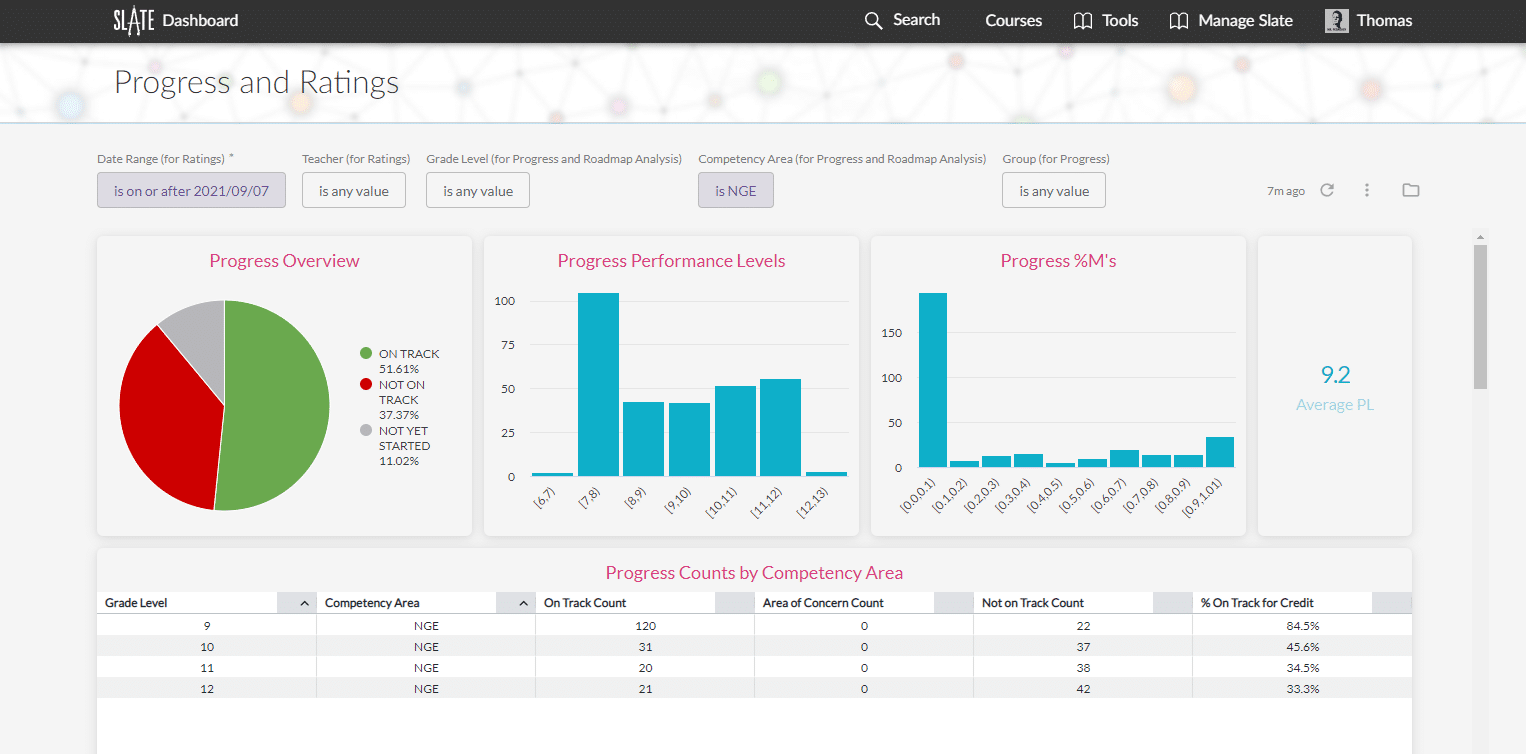
Having all of this data in our warehouse then allowed us to create data dashboards for teachers and leaders to not only track competency data but also track relevant data from across all of their systems (see Figure 8). Being able to organize and analyze individual student data allows teachers and leaders to pinpoint areas in need of improvement and provide the support, professional development, and resources for teachers to personalize learning for students and improve student outcomes.
Figure 8: School-Level Competency Progress Dashboard
We have also started working with elementary schools to streamline data collection for teachers by creating student assessment dashboards as well as clearly communicate to students and families progress and growth in the competencies and other key assessments. Figure 9 shows a sample tab for an elementary student’s ELA progress.
Figure 9: English Language Arts (ELA) My Progress Tab for an Elementary Student
Our competency tracking platform, coupled with our data warehouse and Google Sheets prototyping system, now allows us to create and customize data dashboards for all the schools we support. We are still learning and prototyping the best ways to track, monitor, and communicate data in CBE models, and we continue to share our resources and work with other systems providers to support competency-based learning progressions and the portfolio model. Two of our Learning Innovation Partners, Foundry and LiFT Learning, both provide platforms that support project-based learning and our competency learning progressions.
Finding a system and set of tools to clearly track, monitor, and communicate progress in your competency model is essential, but is not the first step in the journey. Before you choose a system, make sure you have a vision for how you want to organize teaching and learning and that you have a consistent competency framework for instructional design and assessment. Then find a system that supports your vision of what school can be instead of changing your vision to fit within the system you are using.
Learn More (other posts in this series)
- Why Should Schools Transition to Competency-Based Education?
- Preparing for Your Competency-Based Education Journey: A Process for Success
- Building 21’s Teacher Competencies to Facilitate Competency-Based Learning
- Building 21’s Leadership Competencies to Facilitate Competency-Based Learning
- Building 21’s Studio Model: Designing Learning Experiences for Engagement and Impact
- Replacing the Grammar of Schooling with Competency-Based Innovations
- Rethinking the Master Schedule in Competency-Based Schools
 Sandra Moumoutjis is the Executive Director of Building 21’s Learning Innovation Network which is designed to grow and support a community of schools and districts as they transition to competency-based education. Through professional development and coaching, Sandra supports schools and districts in all aspects of the change management process. Sandra is the co-designer of Building 21’s Competency Framework and instructional model. Prior to working for Building 21, Sandra was a teacher, K-12 reading specialist, literacy coach, and educational consultant in districts across the country.